

3D greens are interactive maps that show the slope and elevation of a putting surface, so you can see every ridge, tier, and runoff before you hit your approach shot or line up a putt. In Golf Pad, 3D green maps display slope direction with arrows, steepness with color, and elevation changes with shading – and you can switch between the 3D view and the standard aerial view with a single tap.
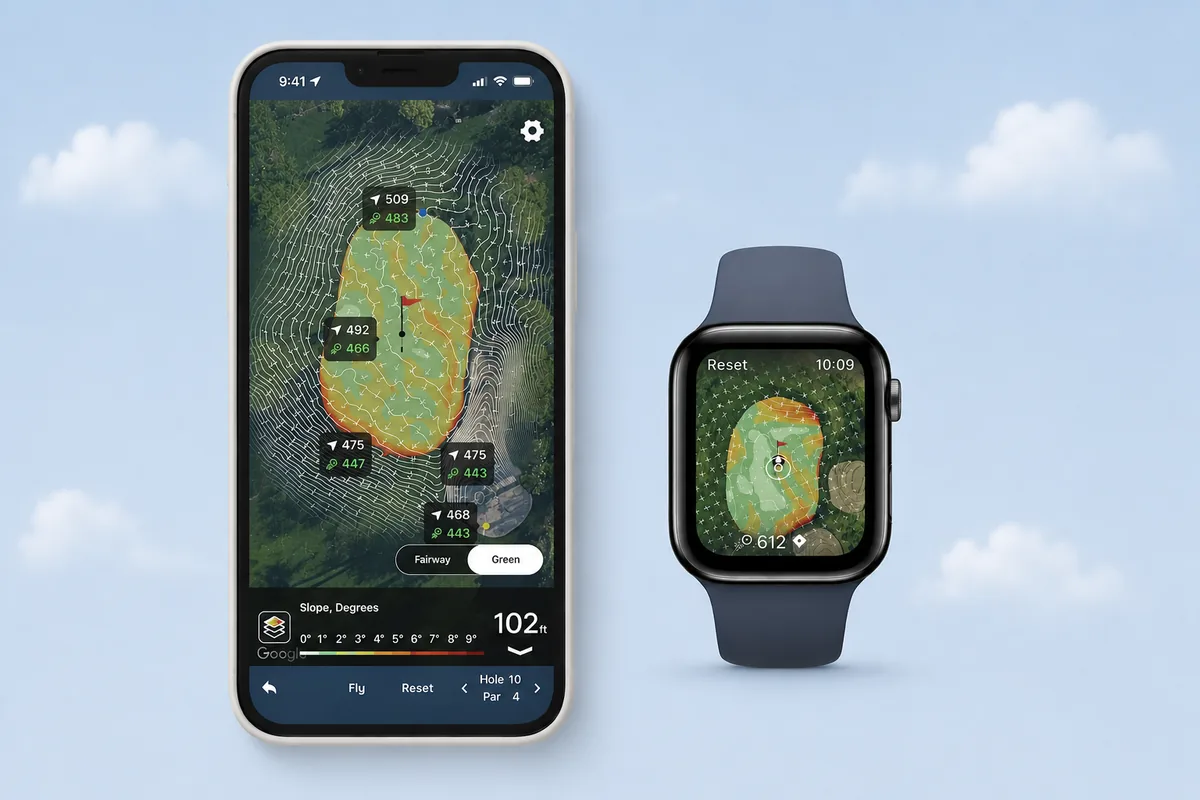
A 3D green map is a detailed model of the putting surface built from elevation data. Instead of a flat aerial photo, you see how the green actually behaves: where it tilts, where it falls away, and where a back pin sits two feet above a front pin.
Golf Pad gives you two complementary ways to look at every green:
Green maps are available on more than 13,000 courses in the United States, with more courses around the world being added, and they work right on the course during your round — no need to study yardage books the night before.
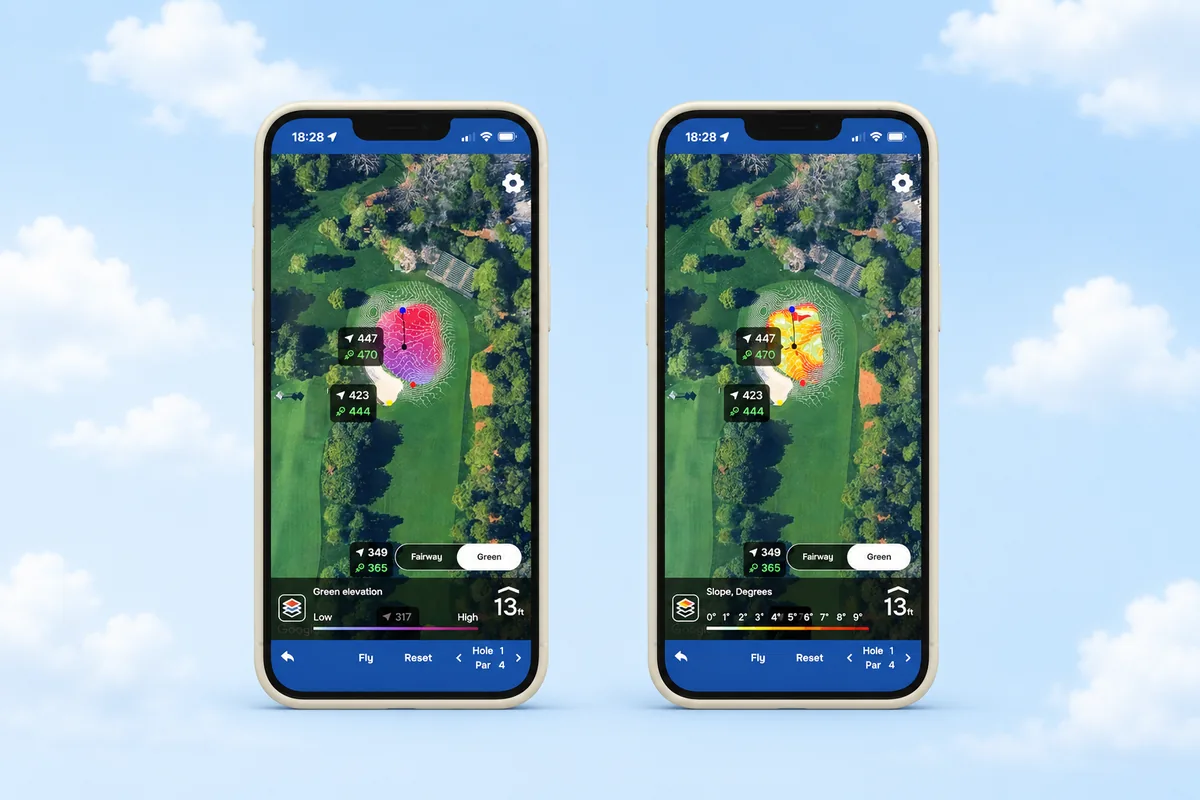
Elevation changes the distance a shot actually plays. An approach to a green sitting well above you plays longer than the GPS number; a downhill approach plays shorter. A common rule of thumb is roughly one extra yard for every yard of elevation gain, though wind, temperature, and altitude all factor in.
Elevation also changes how the ball behaves after it lands. A shot into an uphill green lands steeper and stops faster. A downhill approach comes in shallower and releases more. If you only look at the flat GPS distance, you can hit a perfect shot and still end up 40 feet away — or off the green entirely.
This is where the elevation view earns its keep. Before you pull a club, check whether the pin is on an upper or lower tier, and where the green falls away. On many greens, the difference between the right tier and the wrong tier is the difference between a birdie look and a three-putt.
Here is a simple routine to run through in Golf Pad before every approach:
Golf Pad Premium's PLAYS LIKE distances do part of this math for you, adjusting the raw GPS number for elevation, altitude, and weather conditions so the distance you see is closer to the distance the shot actually plays.
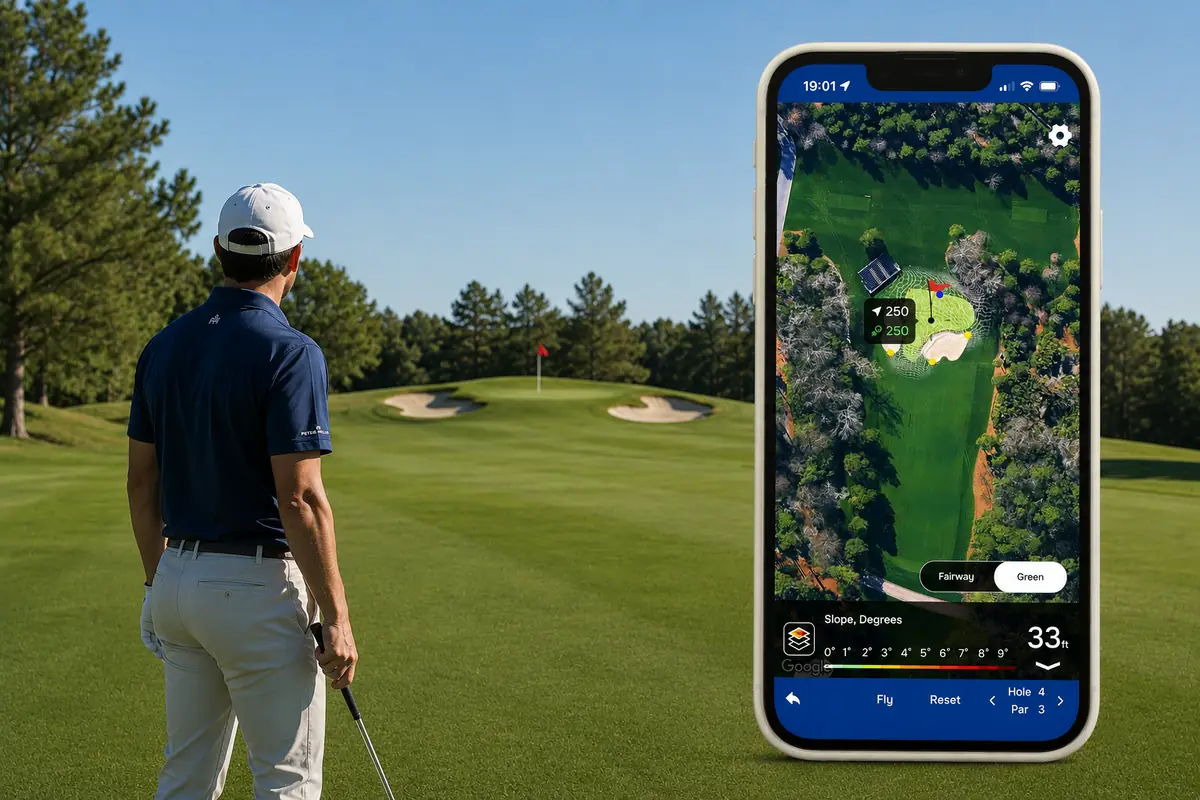
Once you're on or around the green, switch to the slope view. The arrows show the direction of every break and the colors show how severe it is — information that used to take dozens of rounds on a course to learn.
A quick way to use it:
Reading the map takes about ten seconds, and it's most valuable on greens you've never played, where local knowledge would otherwise take years to build.
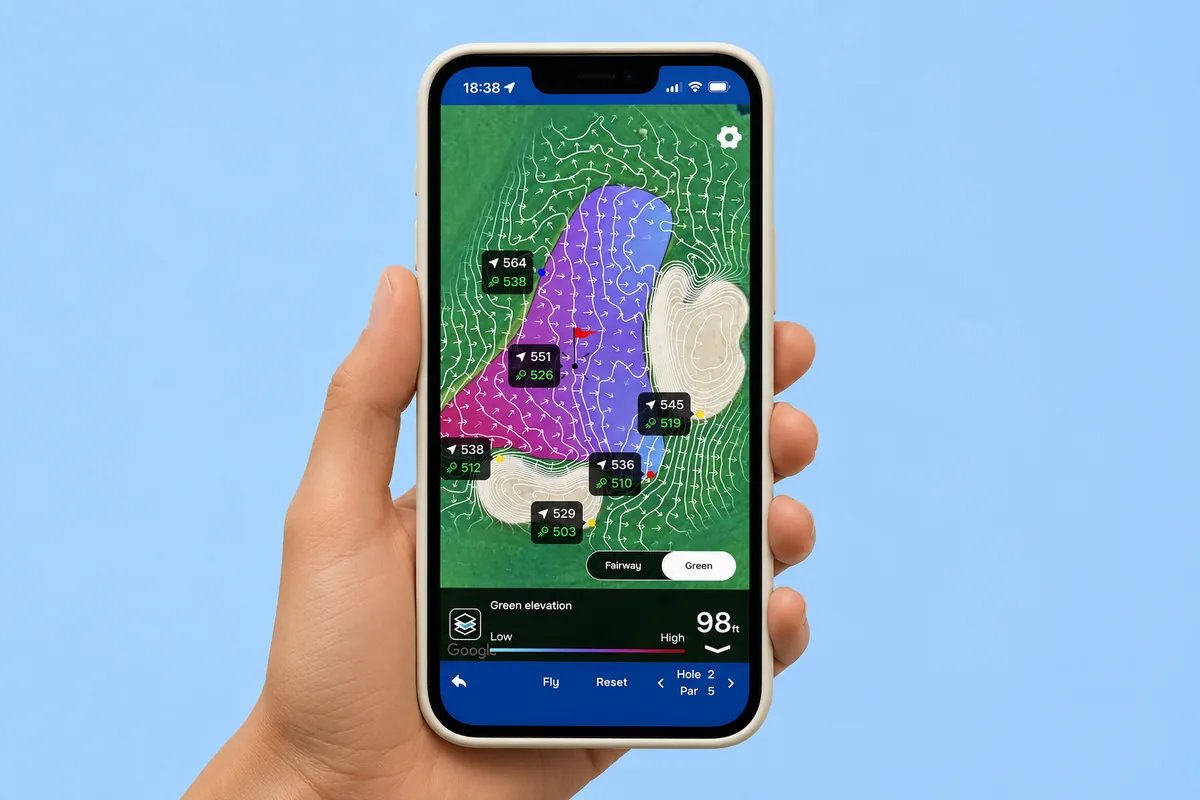
Golf Pad keeps the 3D green maps one tap away, so you're never digging through menus mid-round:
Prefer to play without contour data, or need to comply with competition rules? You can turn green maps off in two places: choose Rules-compliant mode in Round Settings when starting a round, or open Preferences, select Map display, and disable green contours.
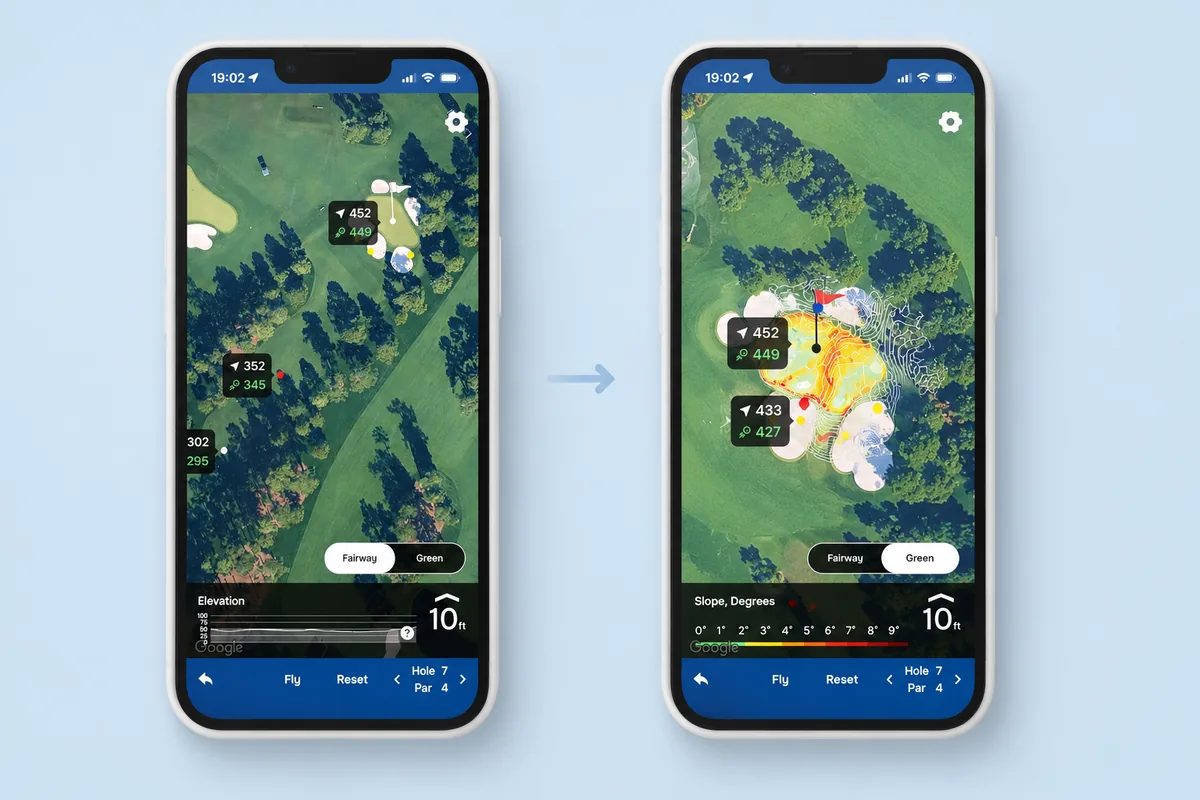
3D greens are maps of the putting surface built from elevation data. They show slope direction, steepness, and height changes so golfers can read breaks and plan approach shots. In Golf Pad, they include a slope view with directional arrows and an elevation view with shaded tiers.
Start a round, open the map view, and tap the Fairway/Green toggle to switch to the green view. Tap the icon on the left to change between slope and elevation modes. Green contour maps are part of Golf Pad Premium.
Green contour maps are available on more than 13,000 courses in the United States, and coverage is expanding to more courses around the world. You can check availability for your course in the app before your round.
Yes. As a rule of thumb, a shot to an elevated green plays roughly one yard longer for every yard of elevation gain, and a downhill shot plays shorter. Golf Pad's PLAYS LIKE distances adjust the GPS number for elevation, altitude, and weather automatically.
Digital green-reading materials are restricted in some competitions. For tournament play, Golf Pad includes a Rules-compliant mode that disables green contour maps for the round — select it in Round Settings, or turn contours off under Preferences > Map display.
Yes. Green contour maps are available on smartwatches with Golf Pad version 20.1.12 or later on Android and 20.1.14 or later on iPhone. Switch to map view on the watch and tap the green to see contours.
The slope view uses arrows and color to show which way the green breaks and how steeply; best for reading putts. The elevation view uses shading to show height changes, with darker areas higher; best for spotting tiers and choosing a landing zone on approach shots.


Subscribe for early access to promotions, feature announcements & more.

